

Discover the best order block trading strategies for smart money concepts, ICT, volume, and momentum approaches. The strategy identifies significant price levels and fluctuations on the chart and candlestick patterns. This approach highlights previous zones with significant buying and/or selling activity. As an active trader, leverage these opportunities to trade in support & resistance areas. Choose your preferred time-frame, ranging from minutes, hours, days and weeks.
Use these tools for forex trading, stock trading, cryptocurrencies and other securities markets. You can also integrate your approach with oscillators, trend lines and moving averages to identify, analyze, and confirm trades. Read on to maximize your trade with OB algo trading strategies.

What Is An Order Block?
Order blocks occur when prices consolidate – followed by a major breakout. These powerful trends cause major market reactions. Bullish order block zones indicate a large number of buyers. Meanwhile where bearish zones represent greater limit sellers. Whenever price trends above this range, you should look to buy as it revisits the target area. These strategies are regularly implemented by SMC & ICT traders.
Types of Order Blocks in Forex Trading
Before implementing your SMC or ICT strategy, familiarize yourself with the types of FX trading order blocks. Of course, there’s a wide range of different OBs and measurement units. For your strategy, here’s the most important ones to fully-master:
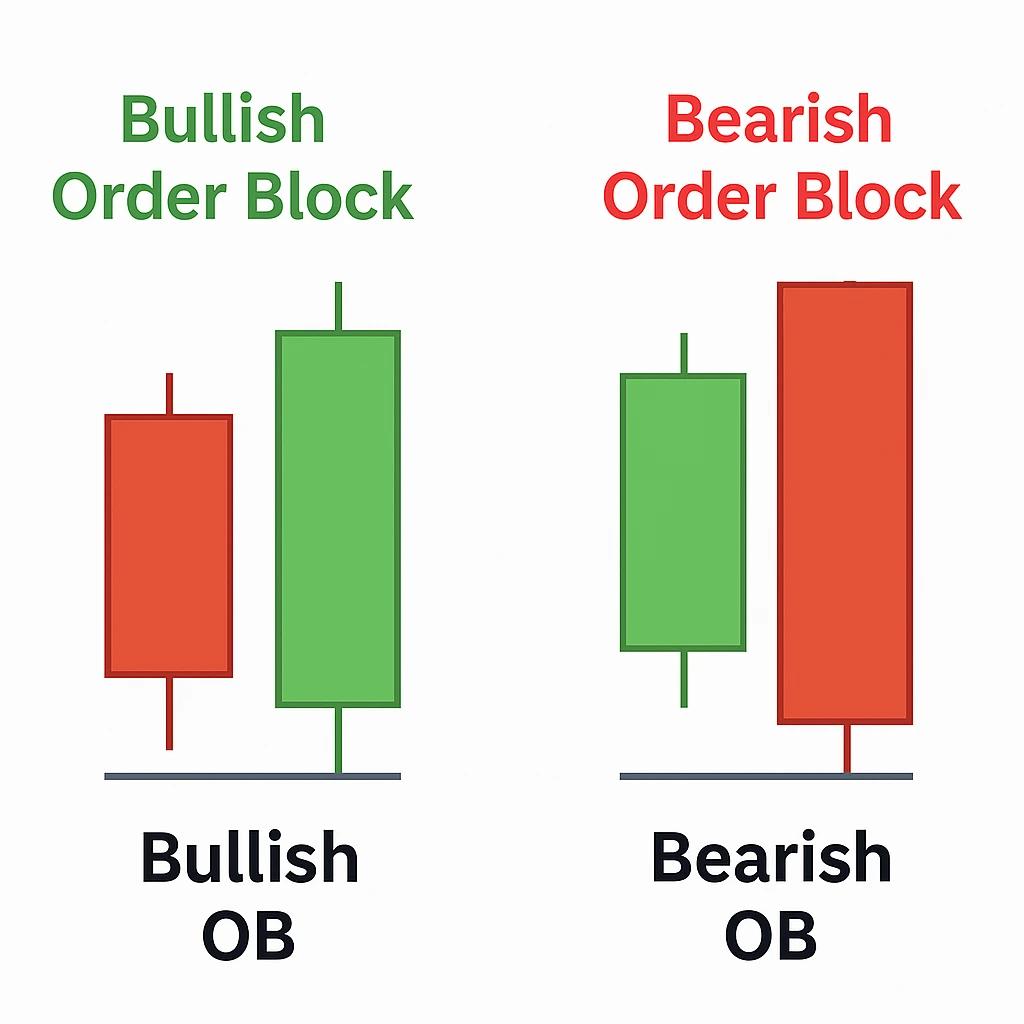
- Bullish – Found Near Support, Final Bearish Candle Before Price Rise
- Bearish – Found Near Resistance, Final Bullish Candle Before Price Drop
- Rejections – Found With Long Shadows On Critical Floors/Ceilings
- Vacuums – Found After Global News Events Open A Gap Range
- Breakers – Found During Downtrends, Last Ceiling Breaks
>> Once you can recognize different types of blocks, leverage these insights as risk management resources, market trend blueprints, and liquidity pool monitoring tools.
After you’ve identified an OB, wait for confirmation, enter the position, and configure your stop loss/take profit. Then, you can carefully monitor the trade & adjust your levels if necessary. Certainly, take time to review the different win rate strategies to implement on your algo trading brokers.
Bullish & Bearish Order Block ICT
Understand the bullish and bearish ICT strategy for trading. The OB can be identified by analysing the chart pattern movements. Look for the area of consolidation to find the bullish order block. These patterns are potentially followed by large bullish market movements. You can draw a box from the last candle to spot the bearish move. On the other hand, Bearish OBs are followed by a large bearish movement on the chart. You can draw the block from the last bullish candle’s high to the low. Leverage this script to trade in all markets, including stocks, crypto, forex, and futures. The OB replies to the market volatility, which makes it better to trade high-volume assets. Definitely, understand how to use bullish and bearish ICT on your confluence algo trading script.
| Bullish Order Block | Bearish Order Block | |
| Definition | Last bearish candle before a strong bullish impulse move. | Last bullish candle before a strong bearish impulse move. |
| Candlestick Pattern | First bearish, second bullish. | First bullish, second bearish. |
| Price Action | – Must grab the low of the previous bearish candle. – Must close above the high of the previous bearish candle. | – Must grab the high of the previous bullish candle. – Must close below the low of the previous bullish candle. |
Breaker Block vs Order Block
Review the difference between the breaker block and OB strategy. Both toolkits significantly impact the result in algorithm trading. The OB trade script allows you to identify high-probability entry points. You can follow the indicators’ footprints to execute a trade on a larger trend. Whereas the Breaker Block script allows you to confirm a valid support and resistance flips. You can leverage this data to spot significant changes in market structure. Combine both into an algorithm to identify OB and look for BB confirmation. Review the key difference between the strategies:
| Key Difference | OB | BB |
| Formation | Before a market move | After a support & resistance break |
| Primary Role | Entry zone | Confirmation zone |
| Identification | Last opposing candle | Former S/R level |
| Psychology | Show smart money accumulation/distribution | Show trend confirmation |
Surely, use a breaker and an order block to find trade reversals.
Order Block Trading Strategy In Crypto
Before you integrate bearish and bullish indicator tools, customize your order block trading strategy for cryptocurrency. If you typically operate as a day trader, prioritize low leverage and a manageable risk-reward ratio. Once these metrics are customized to your goals and risk tolerance, you can follow an organized process to start executing trades.
- Identify and pinpoint the potential order block zone
- Wait for market prices to hit these zones
- Track candlesticks in supply or demand zones (These may be bullish or bearish)
- Identify price breaks or rejections
>> Leverage this approach for ETH-USD, BTC-USD, and other notable altcoins. These assets have high respect zones and large liquidity, which makes them an effective and reliable option. Of course, you should avoid following this approach for highly volatile meme coins.
Utilize your order block trading strategy for cryptocurrencies and altcoins.
What Is Order Block Trading In Forex?
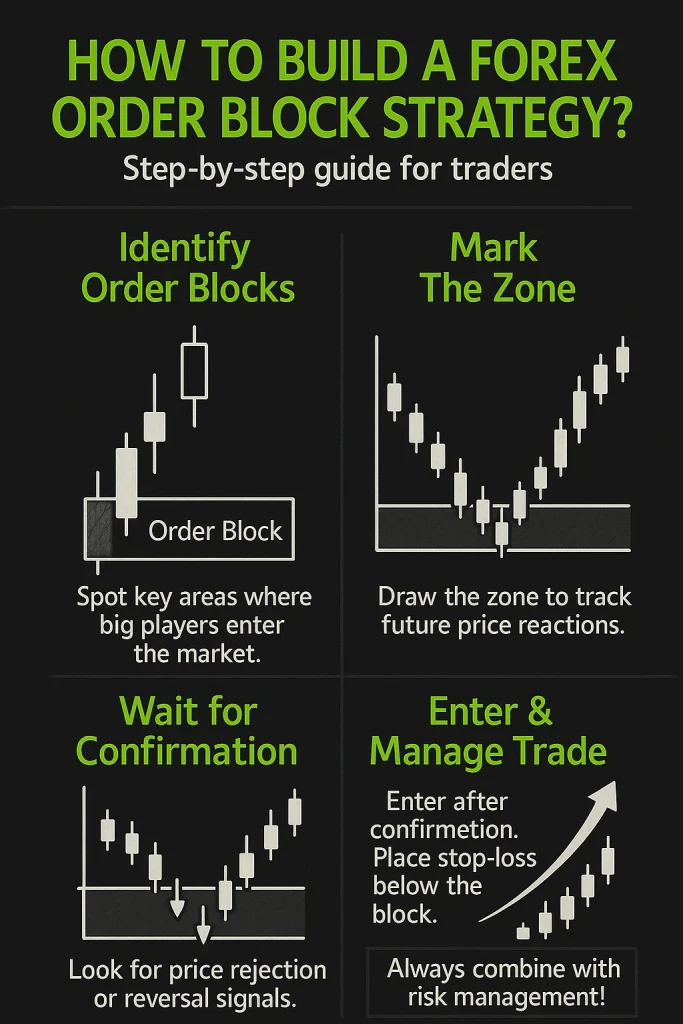
Understand the order block in forex trading. These blocks emerge as pivotal patterns based on market movement. You can strategically use this data to build your forex trading strategy. These blocks serve as a powerful indicator to find valuable market sentiment and future price movements. Understand how you can draw a forex order block zone:
1. Identify price range: Find the area where the price moved horizontally.
2. Mark highs and lows: Note the highest and lowest points in that range.
3. Draw zone: Create a horizontal zone between those levels to see your order block.
Surely, learn how to leverage order blocks in forex algorithm trading.
Order Block Rules of Supply / Demand
Review the order block rules to set up a win rate strategy. The rules are important for drawing the chart to determine the expected price reaction. You can perform technical analysis using advanced indicators. The rules are applicable everywhere in cryptocurrency, forex, and the stock market. Implement :
- Liquidity. Find zones where the price reacts and reverses after taking out previous highs or lows.
- Confirmation: Wait for a clear impulsive move in the opposite direction.
- Break of structure (BOS): The order block should lead to a structural break in market direction.
- Law of force: After confirmation, price usually forms a slow correction in the OTE.
- Volume and candle spread: Look for full-bodied candles with increased volume. This shows market intent and strengthens.
Align order block confirmations with the LuxAlgo Fair Value Gap to validate Smart Money movements. Definitely, consider order block rules.
A Step By Step Guide To Trade Order Block Setups
Review the step-by-step guide to the trade order block. The structured approach will allow you to identify an OB accurately. You can blend trade pattern recognition with an advanced technical analysis tool to find strong price breakouts. Follow the steps below:
- Identify consolidation zones: Identify longer consolidation ranges with clear support and resistance levels to find a breakout.
- Confirm the breakout: Enter only after the price closes outside the consolidation range.
- Candle patterns for confirmation:
- The last bearish candle before an upward move is a bullish OB
The last bullish candle before a downward move is a bearish OB.
- The last bearish candle before an upward move is a bullish OB
- Validate with fair value gaps: FVG is another step of confirmation. The area near the order block confirms institutional activity.
- Use tools and indicators to auto detect: Apply the LuxAlgo toolkit in your chart to automate detection and multi-timeframe projection.
Surely, follow the order block step-by-step guide for your volume-based trading strategy.
How To Find An Order Block
Once you clearly understand timeframes, learn how to find & capitalize on volume-based order blocks. Most commonly, you can find OBs when the market is consolidating. Here, impulsive movements occur when buyers or sellers take over – leading to a break in equilibrium. Ultimately, this causes a major shift in one direction of the market.
>> For bullish movements, utilize the last bearish candle from consolidation to pinpoint your OB. When the shift was bearish, rely on the final bullish candle instead.
Order Block Identification In Markets
Identify a strong OB to implement your trading setups and entries. Theses highlighted areas tend to appear before a change in the market trend. You can see a strong movement of up or down in the trade volume. The strong change forms an engulfing candlestick that crosses over your pre-defined values. Check out various steps to identify strong opportunities:
1. Identify an engulfing candlestick pattern.
2. Draw a rectangle from the candle before the range.
3. Enter a trade in the breakout direction when the price touches and exits the range.
You can even use multiple trade concepts and indicators to identify these OB. Confirm a bearish trend using the EMA crossover. You can use this on all timeframes depending on your forex trades. Surely, use a strong OB approach on forex broker for US traders.
Implement A Risk Management Strategy Using OBs
Implement a risk management strategy while trading order blocks. The technique will manage risk to protect your capital and provide long-term returns. You can limit trade exposure to 1 to 2% of your account balance per transaction to keep the risk manageable. Include this rule in your strategy to prevent trade execution when the parameter is triggered. Check out some of the important risk management options for your script:
- Set a stop loss: Place stops just beyond the order block.
- Wait for confirmation: Enter only after rejection or reversal signals.
- Avoid overtrading: Build quality trade setups.
- Backtest your strategy: Use a demo account and backtesting tools to refine entries and exits.
Surely, use risk management techniques in your order block trading strategy, along with the Fair Value Gap Indicator.
Order Block Backtest Results
Review the backtest results to enhance the trading strategy. The backtesting is an important step in algorithmic trading. You can evaluate the signals in different market conditions to get better results. The result will provide valuable insights into the performance after analysing historical data. Leverage the data to predict the probability of success or failure of the trade. Moreover, you can identify trend strength using a specific OB backtesting pattern. These patterns include multiple zones in the same direction, consecutive HH or LL, and increasing volume. Definitely, use the order block strategy backtest results to update your script.
Increase Order Block Trading Win Rate
With proper backtesting, you can optimize the profitability of your trading strategy. In addition to identifying high-probability setups, the order block technique aims to reveal hidden institutional trades. This is known as the “smart money” in the market, providing volume, liquidity, and momentum. To increase win-to-loss ratio, add filters or confluences to your strategy. Then, backtest your results without risking capital. You can test the following:
- Volumetric Order Blocks
- Stock, Forex or cryptocurrency pairs
- Trend strength vs ranging conditions
- Money order flow positive or negative
- Fibonacci retracement levels above or below
- Retesting significant price levels
- Entry or exit into premium and discount zones
Make incremental changes to your strategy to backtest higher win rates. Keep in mind, backtesting does not guarantee future results. However, you can backtest and then optimize your strategy for higher probability setups combined with a strong risk:reward or RR win rate ratio.
Draw Order Blocks With Technical Analysis
Leverage bullish & bearish indicator tools to streamline order block technical analysis. Pinpoint high-probability OBs that align with core market structural metrics. Start with timeframes – analyze daily pivots, weekly high/lows, and monthly S&R zones. Additionally, check for changes in delivery state – which can happen in response to price movement, high/lows, and displacement (triggering FVGs). Then, confirm institutional levels by evaluating high-volume price levels, previous rejection zones, and ICT PD arrays.
>> Of course, be mindful of stop-loss order clusters near recent pivot lows. Here, you’ll often find liquidity pool, institutional activity, and structural insights worth tracking.
Confirm an order block with technical analysis tools. Combining the strategy with technical analysis indicators enables you to enhance the algo trading script. The tool will identify trading opportunities and help you make informed trade decisions. You can find trends, trading volumes, timeframes, and asset relationships with others. Review some of the important indicators:
- Bollinger bands
- Support and resistance levels
- Volume profile
- Moving averages
- Fibonacci retracement levels
You can create a more effective trading strategy after analysing market price movements. Use this data to customize your script to grab more profitable trades. Surely, use order block ICT online with the technical analysis TradingView tools to understand market dynamics.
Connect Order Blocks With Your Trading Plan
Integrate the order block in your algorithm trading strategy. You can set up OB in your script to find compatible markets and a suitable timeframe. Usually, the large-cap assets display cleaner order blocks than small caps. You must choose 4-hour or 1-hour charts for more accurate trade entries. Integrate technical tools such as Luxalgo to confirm support/resistance levels, trendlines and chart patterns. Review the steps to integrate OB into your trading plan:
- Pick compatible markets and timeframes
- Use with other technical tools
- Apply proper position sizing
- Develop a trading journal focused on OB
The Integration will allow you to track your trades and refine your algo strategy. Surely, set up OB in your algorithm script for better trade execution.
Optimize Your Chart Order Block Settings
Prioritze expert target setting as part of your order block trading strategy. Ensure your OB trading targets align with your liquidity objectives, risk tolerance, and overall requirements. Use widely-recognized internal liquidity targets like consolidation zones or equal high/lows. For external liquidity, focus on previous major swings or fair value gap (FVG) imbalances.
>> Of course, ensure you carefully adjust targets based on the current market structure, as well as your trading session objectives. Avoid common mistakes like entering without confirmation, placing stop-losses too high, or executing during low-liquidity sessions.
Absolutely, clear target setting is fundamental to your overall OB, SMC, & ICT trading strategy.
Monitor Valid and Invalid Order Blocks
Before finalizing decisions, you need to verify that OBs are valid or invalid. In many cases, invalid blocks are generated after inducement – often in response to liquidity hunts. Valid blocks form after aggressive market trends, which lead to displacement and Fair Value Gaps (FVG). At formation, you should also look for a significant spike in overall volume. This indicates that institutional traders & major market players are entering orders.
>> If you’re examining a block without these characteristics, there’s a high chance it may be invalid.
Definitely, review the steps to know algo trading win rate.
Identify Mitigated & Fake OBs
Now, you should understand how to pinpoint mitigated and fake OBs. Simply put, false blocks lack the key factors, elements, and components that define authentic configurations. You may find that these poorly demonstrate strong price reactions or overall market interest.
Here’s some of the factors to help you identify ingenuine OBs:
- Weak Price Movements: Limited After Formation
- Low Volume: Minimal Trading Activity
- Mitigated Zones: Prime Restests, Then Breaks
>> Mitigated or false blocks regularly confuse and mislead traders. You need to carefully verify validity to avoid making costly decisions and trading mistakes.
Of course, you should understand how to spot fake & mitigated order blocks quickly, accurately, and effectively for your 1-Minute Scalping Algo.
Map Liquidity Zones And Order Blocks
Understand the process of mapping liquidity zones and order blocks. The mapping of these will allow you to enhance strategy and improve risk management. These areas on the price chart show concentrated trading activity. You can leverage the data to identify potential LuxAlgo trade reversals and set a stop loss. Follow these quick steps to map these zones:
- Choose a timeframe: 4 hours for swings and 1 hour for intraday setups.
- Identify indicators: Allows you to spot volume spikes, reversals, or price rejection.
- Validate zones: Review price reactions, volume, and multi-timeframe.
- Use advanced tools: Combine analysis with LuxAlgo tools to trade automatically.
Finding these zones will provide clarity on market structure and activities. Definitely, follow the process to map both liquidity zones and OB.
Strategically Manage Risk
Use this data-driven indicator to manage risk in day trading algos. You need to implement a stop loss to mitigate risk while implementing strategies. Position your stop loss below the lowest level point if you are going with a bullish trade direction. You need to adjust your stop-loss level each time the price retests a support or resistance level. The readjustment is important as there can be a further decrease in tend. These blocks help you manage risk and safeguard against possible financial loss. Moreover, calculate your risk tolerance level to understand how much capital you can put at risk.
Implement Dynamic Order Flow Strategies
Learn to trade order a block trading strategy based on volume. The indicator displays dynamic bullish and bearish OB areas, showcasing support and resistance levels in each direction. Mainly, the tool uses price action analysis to identify reversal or continuation zones on breakouts. You can use the swing back setting to identify long-term movements, behaviors, and trends. The standard range for swing back ranges from 10 to 20 level, lower the range for quick scalping. Identify the market direction on a break of OB area. The direction is bullish when the current market price breaks the bearish OB. Enter bearish on a break of uptrends. Surely, use look-back feature to enter swing trades on your forex AI trading platform.
Role of Timeframes in Order Blocks Strategy
Review the role of timeframes in the order blocks trading strategy. The selected timeframe can highly impact the ability to find order blocks. You can perform multi-timeframe analysis to understand the market structure. The data will allow you to find entry and stop loss points more accurately on the chart. Leverage the zones to know minor price fluctuations for better algo strategy development. You can choose the timeframe based on your script to get a broader or more detailed view. Surely, understand and set the timeframes based on your order blocks strategy.
Leverage Momentum Breakout Strategies
Momentum breakout is another expert institutional approach. Leverage this indicator to locate specific momentum bursts in the market based on current price actions. By identifying the market momentum, you can open new positions when new buy/sell signals emerge. Keep in mind that you must closely monitor candle color changes. For instance, a color change usually indicates that institutions managing the OB may start a new price trend soon.
Follow these guidelines to protect your positions while executing momentum breakout strategies.
- Adjust your parameters based on market volatility and personal risk tolerance to suit target market conditions
- Use MACD and RSI to filter high-risk signals that may lead to major losses
- Manually review parameters for each signal before the final execution
Ultimately, you can leverage the candles and market graph to detect potential breakout directions in advance. With momentum level, you can also carefully manage underlying risks on each signal. Simply place limit orders over auto-execution on signals to avoid unexpected losses – even when buy/sell signals.
Order Block Strategy With Examples
Checkout order block strategy examples to get a high win rate. The strategy involves identifying and trading significant price levels on the chart. These areas represent where large buying or selling activity occurred in the past. You can leverage these points to know future support or resistance levels. Check out the example of the trade setup done using order block strategy:
- Spot activity: Identify price charts with clear buying and selling zones.
- Mark order blocks: Highlight key buy and sell areas.
- Check price action: Assess if the price will respect or break the block.
- Plan trade: Execute the trade with a stop loss just beyond it.
Surely, review the order block setup strategy to get a high win rate on trading stocks, futures, forex, and cryptocurrencies.
How To Build Your Own Order Block Strategy?
Learn how to build an order block strategy for forex trading. The strategy involves buying and selling an asset within a specific price range or level. You can use FX OB to trigger a market reaction alert based on an institutional investor’s large order. Leverage these opportunities to place a series of small orders. Follow the steps to create a forex order-block strategy:
- Mark HTF OB: Mark the open and close of the candle on the chart
- Wait for liquidity sweep: Wait for the price to run stops above a prior high or below a prior low.
- Enter on confirmation: Check for a lower-time-frame structure break or momentum to enter.
- Place stops: Place stops beyond the invalidation wick
- Target opposing liquidity: Target the liquidity at the next untouched swing high and low.
Surely, built a machine learning trading strategy using a forex order block to auto execute trades.
Build The Best Order Block Trading Strategy
Mastering Order Blocks will help you recognize institutional activity over random price fluctuations in the market.
Some strategies like price action patterns, timeframes, confirmation, and risk management are crucial to succeed in identifying key price zones. Listed below are some of the most helpful tips:
- Focus on higher timeframes for stronger Order Blocks with considerable institutional activity.
- Large orders produce smoother price movements so look for more uniform candles.
- A revisited order block decreases your trading advantage so look for fresh and unmitigated order blocks where prices will react.
- Confirm more than once using candle patterns and fair value gaps
Always identify, validate, and confirm order blocks carefully, and manage your risk by ensuring to limit each trade to no more than 2% of your account.
A Customized Order Block Strategy
Use the block trading strategy for forex trading. The FX block shows the price zone where institutional traders placed their buy/sell orders. Use these levels to spot high market activity zones. You can incorporate your script depending on these future price movements insights. Understand why OB are important for forex trades:
- Institutional activity: Highlight zones of significant buy/sell orders
- Trade accuracy: Filter out noise and focus on price zones
- Find key levels: Support and resistance for entry/exit points.
- Risk management: Use for stop-loss and take-profit zones.
Leverage the forex OB indicator for algo trading. Additionally, use the LuxAlgo order block detector to align with institutional activity and strengthen your forex reversal trading strategy.
Validate Order Blocks
Learn how to identify a valid or false order block in trading. Validation confirms whether the order block originated from institutional activity or random price movement. You can verify a block by analysing volume spikes, unmitigated status, price imbalances and liquidity sweeps. Review the key difference between the valid and false order block:
| Criteria | Valid Order Block | False Order Block |
| Formation Context | Forms after inducement or liquidity hunt. | Forms randomly without liquidity grab or inducement |
| Market Reaction | Leads to strong displacement and creates Fair Value Gaps (FVGs) | Fails to create strong moves and price action. |
| Volume Spike | Shows a clear volume spike indicating institutional entities | No increase in volume |
You also need to monitor the latest news, as they can either create new OB or false single. Surely, use the data to find a valid or a false signal for algo trading.
The validation confirms the order block originates depending on market activities. You can find out whether the event happened because of institutional activity or random price movement. The volume spikes show where the institutional orders are generating higher trading volumes. You can leverage these data to execute your algo trading strategy. Learn how you can use validation criteria in your strategy:
| Validation Criteria | Details |
| Price Imbalances | Highlights liquidity absorption and price movement |
| Multi Timeframe Visibility | Validates the zone relevance across multiple market |
| Liquidity Sweeps | Indicates institutional accumulation or distribution activity |
| Volume Spikes | Signals strong institutional order execution |
| Unmitigated Status | Confirms active orders remain influential |
Leverage Luxalgo indicators on TradingView charts to get precise insights. Definitely use order block advance tools to streamline the validation process.
Avoid Common Mistakes Traders Make
Review the common mistakes traders make while using the OB strategy. The order block is an effective trading strategy for identifying significant buying or selling zones. Traders usually make several common mistakes while setting it up. Learn some of the often-made mistakes for better decision-making:
- Don’t solely rely on order blocks: You must combine them with indicators like Moving Averages, RSI, or MACD for better analysis.
- Learn to identify OB correctly: Take time to practice and build experience for better order block identification.
- Check the broader market context: Review real-time trends, news, and economic data.
You must always prevent placing the stop loss close to the order block. Usually, in these areas, the price may spike and hit stops before reversing. Surely, remember to prevent these mistakes that can negatively impact your results.
Risk Management Tips for Order Block Trading
Learn risk management tips for an order block trading strategy. Always define criteria such as risk-reward ratios, position sizing, and stop-loss in your strategy. You should never risk more than 2% of your account balance. Defining the profit target is also essential as stop-loss placement. Review some of the better risk management tips you must consider while trading:
- Set profit targets and lock profits early to build a buffer.
- Only trade valid order blocks formed after the inducement.
- Always follow a trading plan and focus on the long term as OB can fail.
- Understand the difference between breaker blocks and mitigation blocks.
Surely, follow a proper risk management plan with your reversal trading strategy.
Order Block Vs FVG Which Is Better?
Before you implement a beginner-friendly strategy, compare order blocks versus FVGs – then determine which is better. Fair value gaps represent the range between one period’s closing compared to the opening price at the next. Ultimately, an FVG signals a short-term, temporary market inefficiency. Alternatively, order blocks highlight significant support and resistance levels, indicating where large institutional orders and market players are buying.
>> Simply put, FVG trading strategies capitalize on gaps that are likely to get filled. OB methods, on the other hand, are focused on high-probability opportunities in strategic price zones.
Compare block vs FVGs before implementing a beginner-friendly model.
Volumetric Block Trading Strategies (Ultimate List)
Understand volumetric OB to upgrade your trade strategies. These display areas of high activity from experienced traders. Indeed, you can leverage this data to identify strong support or resistance zones. Once mitigation occurs, these volume-based zones are automatically removed. There are two types to consider:
- Bullish OB are located at the low swing and used for trade support.
- Bearish OB are used for potential resistance and located at the high swing.

Surely, increase the length settings for long-term insights & data. This chatgpt algo trading setting adjusts the swing point detection for your signal. Additionally, learn how to use the volumetric order blocks indicator with LuxAlgo for automated trading.
Order Blocks For Price Action Traders
Leverage price action trading strategies to identify bullish and bearish order blocks. When locating order blocks, look for clean price actions with minimal wicks. These cleaner and less noisy structures indicate a stronger order block with multiple institutional players placing trades. Of course, a messier price action with multiple wicks can indicate a weaker OB, which may not be ideal for a stronger trading setup. Additionally, a stronger OB can help identify precise entry zones over general areas to trade along with institutional players. Once you identify a cleaner price action, leverage strategies to trade in the direction of the larger trend. This way, you can enter trades with high-probability entry points and maximize your overall performance.
MTF + MT5 Indicator Strategy
Develop advanced techniques with the MTF MetaTrader 5 indicator. The Indicator reveals high volume by blending multi-timeframe analysis and price action technicalities. Further, the software identifies reversal areas, strategically created by major market makers using buy and sell orders. Identify potential reversals using the 50% markup line (Fibonacci area) available within specific OB.
Leverage features available inside the MTF tool:
- Reveals market perspective by displaying 3+ time-frames.
- Displays indicator properties on a pre-loaded chart template.
- Customizing amplitude and dynamic color adaptation for buy and sell signals.
Choose specific numbers to identify price action behavior, where recent bars hold the strongest market sentiment. You can also amplitude the OB value to get areas with high trade volume. Indeed, identify reversal areas using alternative time-frames in the forex industry.
Order Block Trading Strategy with BOS and Choch
Use an order block with BOS and Choch for your trading strategy. Not all order block areas formed on the chart are tradable. The institutions’ traders try their best to trap retail buyers in fake zones. You can use confluences in your trading script to find high-probability zones. Review the BOS & OB and Choch & OB strategies:
BOS and OB trading strategy
- Find two Break of Structures (BOS) and the formation of higher lows.
- Identify the OB in the direction of the BOS. Bullish BOS find bullish blocks, and Bearish BOS find bearish blocks.
- Execute pending orders in that area.
- Take profit at the next BOS or when a Coach pattern forms.
Choch and O-B trading strategy
- Find the Change of Character (Choch) on the chart.
- When the trend flips bullish, find a bullish block. If the trend flips bearish, find a bearish block.
- Trade the order block on the retracement
- Take profit at the next BOS pattern.
You can use these methods to find the area and direction to trade in the market. Make sure to adjust the timeframe based on your trade execution script. Surely, use BOS and Choch in your algo trading strategy.
Break Of Structure Based On Supply / Demand
Of course, you can include break-of-structure (BOS) blocks into your trading strategy for beginners. The BOS model aims to validate price trends in a consistent direction. When BOS is bullish, it indicates that asset price will continue to rise, whereas bearish blocks emphasize an ongoing decrease. To identify a bearish BOS, pinpoint a high-lower compared to the most recent high (higher low > HL). Then, find a low-lower compared to the previous low (lower low > LL). Once identified, implement break-of-structures to confirm market direction and structure. Utilize break-of-structures for a beginner-friendly OB trading strategy.
Dynamic OB Strategy
Use a dynamic OB strategy to identify key support and resistance levels in real time. You can directly see the latest bullish and bearish OB zones on the chart. These indicators help recognize high market participation levels. Leverage these areas to know the major price shifts. These zones also show the price reversals or continuations. You can use this data for edge development and auto trade execution. Check out some important settings to fine-tune your profitability:
- Swing Lookback: Set duration of swing detection for OB.
- Use Candle Body: Uses only the candle body to define the OB area.
The indicator is available on charting platforms like TradingView, MT4/MT5, and NinjaTrader. Additionally, you can combine the order blocks and the fair value gap indicator to supercharge your algo trading.
High Probability Order Blocks
Use a high-probability order blocks trading strategy as a beginner. The smart money concept allows you to find high-probability block in trading. The concept includes break of structure, sell-side liquidity, buy-side liquidity, and change of character. These will enable you to locate areas where institutional buyers are executing trades. You can add confluences in your strategy to increase the probability. The confluences will protect you from falling into fake trade zones. Make sure to always backtest your trading strategy before going live. Surely, use high probability order blocks in your algo trading script.
Predictive Order Block Zones
Connect the predictive order blocks indicator in your algo trading strategy. The tool allows you to identify support and resistance blocks using the median line. You can leverage these lines and standard deviations to execute successful trades. The strategy provides a more accurate OB during the period of expansion and consolidation. Check out the key features of using the blocked order prediction tool:
- Multi-term length analysis: Use short, medium, and long-term settings for flexible trading strategies.
- Standard deviation: Allows you to create reliable support/resistance zones instead of single-point levels.
- Dynamic box creation: Generates breakout boxes after consolidation.
- Gradient colour display: Colour changes based on price proximity to deviation bands.
Leverage the predictive model to analyse complex market conditions effectively. Surely, use the blocked order prediction tool for your algo trading strategy.
Block Trade Indicator Strategy
Use the block trade indicator in your algo trading strategies. The indicator auto-detects and maps higher timeframe blocks on the chart. These areas show institutional buying or selling pressure, which act as powerful S/R levels. You can use the indicator to align lower timeframe entries with higher timeframe blocks. Leaving the tool will help you reduce noise and focus on important price levels. Understand what the indicator does:
- Scans your chosen higher timeframe for bullish and bearish blocks.
- Plots blocks on your current chart.
- Signals when price returns to and reacts at these zones.
- Trigger alerts on potential opportunity
Combine the block trade indicator with your existing strategy for stronger confirmation and improve your win rate. Surely, use the block trade indicator in your algo trading script.
Reversal Order Block Trading Strategy
Find reversal opportunities using smart money concepts including OBs, fair value gaps and liquidity zones. Some high-win rate strategies also add RSI, Fibonacci, and moving averages add extra confluence or confirmation filters. By using a variety of indicators, you can:
- Identify significant price levels
- Filter valid or invalid OB
- Find opportunities for bullish or bearish rejection
Since these zones have high volume of trades, the levels act as support or resistance. If you combine these key areas of activity, you can plan your buying and selling when price has a higher likelihood of reversing. Certainly, this trading reversal strategy is very popular price action approach with a high win rate.
Valid Order Block Detection Methodology
Leverage the OB detector in your trading strategies. The tool allows you to identify the market participants’ areas on lower timeframes. The indicator marks the volume peaks as an OB. Within the indicator, you can choose from wick or close distinct mitigation methods. These options allow you to fine-tune your workflow for auto trade execution. Check out the key settings for the automatic volume detector indicator:
- Mitigation methods: Choose “Wick” or “Close” to define when an OO is mitigated.
- Average line style and width: Customise how the average order level shows.
- Bullish and bearish OB: Set how many bullish or bearish level you want to show on the chart.
The indicator also provides you alerts for smart trade decisions.

Volumetric Order Block Strategy
Master the volumetric order block strategy for forex trading. The tool identifies the areas where there are high market participants. You can use this level to find potential support or resistance levels. The indicator automatically highlights these areas and disappears once they are mitigated. These OB are of two types: bullish volumetric blocks and bearish Volumetric blocks.
- Bullish Volumetric OB: Area near the swing low and used as a support.
- Bearish Volumetric OB: Area near the swing high and used as a resistance.
Volumized Order Blocks
Use the volumized order blocks strategy for algorithm trading. The indicator shows the blocks with volumetric information on the chart. You can customize the parameters such as detection, invalidation and style settings. The volumized tool allows you to pinpoint existing market orders on different price ranges. You can find the OB using a specific block pattern formation on the chart. Make sure to consider the high and low volume blocks to identify the market strengths. Check out the features of the volumized order blocks indicator:
- See bullish and bearish OB
- Enable and disable volumetric information based on requirement
- Enable and disable historic zones
- Customise chart and pattern visual
Surely, leverage volumized order blocks to improve your trade win rates.
Pure Price Action Order & Breaker Block Strategies
Use a pure price action order and breaker tool in your trade strategy. The indicator allows you to find OB on the price action pattern. Using this, you can analyse market conditions and spot potential trade opportunities. The tool also helps convert these levels into breaker based on market conditions.These breaker level can be detected without any predefined input length. Check out the indicator customizable settings for better chart analysis:
- Detection: Choose the market structure to find the swing point
- Show last bullish OB: View recent bullish orders/breaker level.
- Show last bearish OB: View recent bearish order/breaker level.
You can access this tool on the LuxAlgo library for various charting platforms. Surely use pure price action orders and the breaker tool for trade automation. Discover the best LuxAlgo signals & overlay settings to refine your TradingView strategies.
ICT Propulsion Block Trading Style
Choose the ICT propulsion tool in your trading style. The indicator allows you to find interaction zones between prices and preceding levels. You can use these areas to know market turning points. Check out the important setting of the ICT propulsion indicator:
- Swing detection length: Set the lookback period to find key swing points.
- Mitigation price: For mitigation analysis, use candle closes or wicks
- Highlight propulsion signals: Mark important trade signals.
- Remove unassociated OB: Hide unassociated OB
- Most recent blocks: Optimise script to analyse recent data
Surely use the ICT propulsion OB robust tool in your TradingView algorithmic trading strategies.
Magic Order Blocks Algorithms
Create a powerful, algo-based strategy with magic OB. Access clear, actionable, and minimalist-level insights on key higher/lower blocks. Leverage novel filtering methods to monitor consecutive bearish & bullish candles. Additionally, measure average true range (ATR) on volatile price trends.
For a comprehensive view, carefully configure the following settings:
- Number Of Consecutive Bars
- Bullish/Bearish levels Above Or Below Last
- ATR Filters
- Closest Trade levels
> Once in-place, the MW default view highlights recent overhead above current price levels – which can signal support & resistance.
Use TradingView’s magic (MW) on your AI-powered algorithmic trading.
Crystal Order Block
Use the crystal indicator in your algo trade strategy. The tools help you to identify key institutional OB. You can leverage this indicator in your smart money concepts and institutional trading strategies. The crystal order block gives you a clear analysis of high-probability trade setups. Check out the features of using this tool in your algorithmic rules:
- Auto OB detection
- Highlight unmitigated
- Multi timeframe for scalping, swing, or intraday strategies.
- Risk management to improve trade entries and exits
Definitely use the crystal OB in your backtesting algo trading strategy for better market analysis.
Breaker Blocks with Automated Signals
Leverage breaker order with signals in your forex trading. The indicator uses breaker blocks to identify potential trade setups. You can enhance your strategies using these signals. The tool highlights the signals between price and breaker blocks on the chart. These areas serve as the take-profit and stop-loss levels. You can even set up auto alerts to get notifications of each signal. The indicator follows precise rules to generate signals:
- Bullish-breaker: Price opens within the block and closes above the upper limit.
- Bearish-breaker: Price opens inside a block and closes below the lower limit
Surely, use breaker OB signals in your algorithmic trading.
Volume Continuation Strategies
Use a volume based order block trading strategy in your algo. The tool helps you spot OB based on price structure. You can use this approach to find key supply and demand zones. The indicator identifies bullish and bearish OB using EMA crossovers. These levels show the associated volume and strength of a particular trade. Review the different usages of volume indicator:
- Identify reversals and continuation points.
- Confirm breakouts beyond support or resistance zones.
- Detects OB reversals with EMA.
- Set limits for stop-loss or entry points.
Surely, leverage the Volume OB indicator in your algo-based trades.
Trade A Market Structure Breakers Strategy
Choose the Market Structure (Breakers) tool for your OB trade strategy. The indicator shows the interaction between price movements and market structures. The levels are highlighted using various graphical elements on the chart. You can leverage the tool to find points where market structures are confirmed. These structures are identified when price action breaks a previous swing level. Check out the indicator configuration settings:
- Swings period: Shows the period for detecting swings.
- Maximum breaks: Number of breaks to be classified as broken.
- Breaker maximum duration: The maximum lifespan of a breaker
Definitely, leverage market structure (Breakers) when planning key entry and exit points.
RSI Support & Resistance Breakouts
Create RSI support and resistance breakouts for algo trade. The indicator RSI calculation helps you to show market squeezes and breakouts. Leverage that data to find out areas where the market is pushing back against price action. You can use the tool to identify support and resistance levels based on market momentum. Review the important features of the RSI tool:
- External Zone: Identify where the highs and lows were left behind.
- Internal Zone: Identify where the highest and lowest values are to see the squeeze
Certainly, master the RSI support and resistance breakouts using significant buying and selling zones.
OB Strategic Application
Learn how to implement the strategy for algo trading. After identifying the reversals that follow the failure of supply or demand zones. You can set up trade entries based on these achieved zones and signals. Leverage the bearish breaker block to execute the short positions. You need to find further declines once price rejects the previously supported level. Analyse the bullish breaker for a potential long trade position. The blocks show the continuation of the market rise after reaching a significant resistance. You can define these execution parameters in your trading strategy. Definitely, start using OB strategically for automated trades.
FAQ’s
What Is The Best Timeframe For Order Blocks?
You should also determine the best timeframe for order block trading strategies. In the first step of your approach, aim to mark the higher time frame charts such as the 1D, 4H, or 1HR. Specifically, highlight the anchor candle’s open & close to project it forward. Then, you can enter once a lower timeframe at 15m, 5m, or 3m – which breaks market structure & momentum.
>> Ultimately, you want to time your entry right before explosive market moves & major trends. The best models incorporate multi-timeframe analysis, accurate price control, and liquidity sweeps.
Learn the best entry/exit timing strategies for your order block trading strategy.
Why Are Order Blocks Important?
If you haven’t yet implemented a strategy, you may be wondering why order blocks are important. In summary, OBs provide accurate & actionable insights into real-time market traders. Specifically, these enable you to follow trends triggered by big banks & institutional traders. Here’s a brief summary:
- Strengthen Risk Management: Leverage Blocks For Stop Losses & Take Profits
- Spot Institutional Activity: Highlight Locations With High Market Interest
- Maximize Trade Accuracy: Focus On Key Areas & Filter Out Noise
- Pinpoint Core Zones: Identify Profitable Entry & Exit Positions
>> Keep in mind, following order blocks doesn’t always guarantee profitability or future results.
Once you’re ready to implement a strategy, take time to review the importance & impact of OBs.
How To Draw An Order Block On Your Chart?
Of course, you should also know how to draw order block zones on your trading charts. First and foremost, you need to carefully analyze the chart’s price block or overall range. Here, carefully mark the lowest & highest points with your preferred tool. Then, you can draw a horizontal line between the two peaks – this can now be referred to as your OB zone.
>> To maximize profits & limit risks, focus on buying & selling within this key area. These are where big banks & financial institutions are typically placing their orders.
Before implementing your OB trading strategy, determine how to pinpoint profitable zones on your chart.
How Do Order Blocks Work In Smart Money Concepts?
Understand why the order block is an important part of the SMC. The institutional traders use the smart money algos in price action trading. You can apply the concept to trade in all markets, including forex, stocks, and indices. These zones are only valid when the market creates a fair value gap after the OB. You can use advanced indicators to find out these areas. The creation of FVG makes the price react and return to its position. Definitely, understand the OB in SMC to know the upcoming market direction.
How To Identify A Mitigation Block?
Before you implement volume-driven OB strategies, you should know how to accurately identify mitigation blocks. Start off by analyzing the current price direction. Look for trends that’re consistent – but failing to break previous high/lows or create new uptrends/downtrends. Whenever this failure occurs, price reversals often trigger breaks that lead to a confirmed market structural shift.
>> Your zone or candle immediately before the price reversal is now the mitigation block. Unfilled institutional orders typically occur in this area.
To confirm the setup, leverage fair value gaps (FVGs), liquidity sweeps, and multi-timeframe analysis. Now, carefully wait for price levels to return – often in response to new liquidity voids. Prior to implementing your volume-based approach, understand how to identify mitigation blocks.
