

Volumetric order blocks support powerful trading strategies. These indicators are available on the most popular trading platforms including TradingView, MT4/MT5, and broker specific software. Each indicator has specific settings, filters, inputs, and styles. Traders install these tools to confirm order setups, entry/exit points, and visualize movements. In this post, we’ll cover the most advance LuxAlgo order block indicator and strategies.
Volume Info And Data Visualization
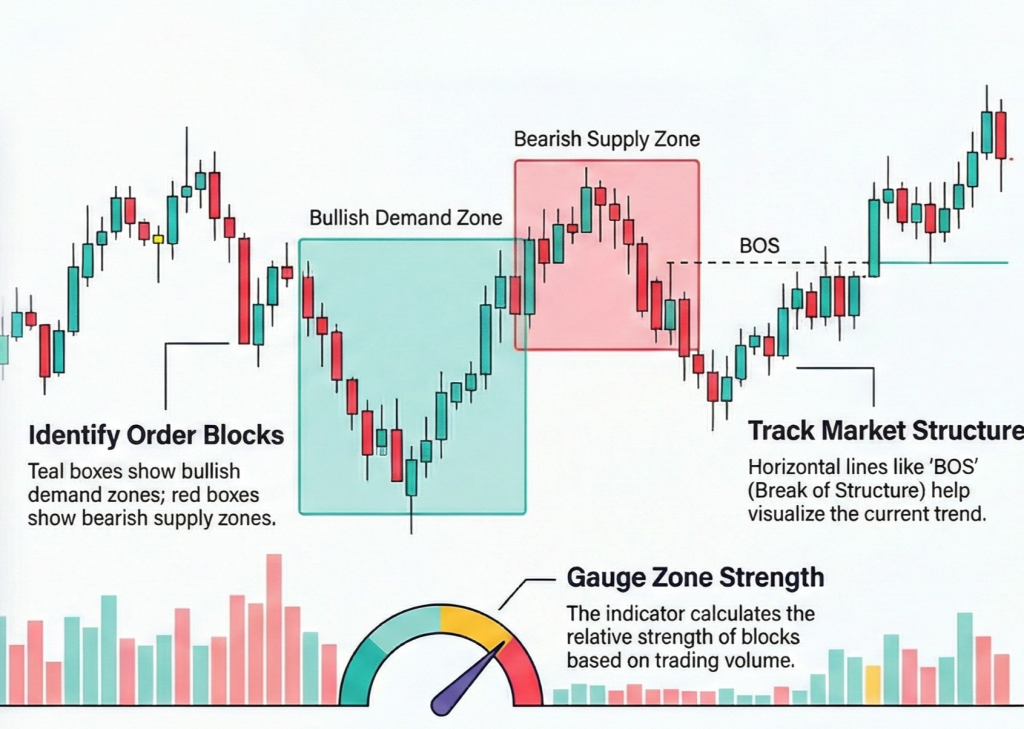
Volumetric order block data offers valuable insights to execute your trading strategies. The indicators highlight zones based on volume. In addition, the tools add another layer of analysis based on the sensitivity, strength, and reliability of the block. The volume based indicator settings can offer insights based on:
- Total volume profile
- Candle high or low ratio
- Percentage of buyers and sellers
- Total bullish or bearish volume comparison
With these highlighted zones, you can analyze where the higher or lower percentage of trading orders are waiting. Plus, you can combine FVG and order block strategy to find mitigated areas.
Price Action Volumetric Blocks
Leverage the price action volumetric OB tool to identify significant price levels in the market. These zones are mapped based on price action and volume analysis. You can even use the combination to find areas where large orders are placed. Analysing these price swings and volume activity helps in pinpointing key Luxalgo support and resistance levels. Understand the key features that the toolkit offers:
- Swing length to identify the detection price.
- Show last order blocks on the trading chart.
- Violation check to find potential violations.
- Colour scheme for bullish and bearish block.
Definitely, integrate the price action volumetric OB in your strategy to execute a trade.
How Price Action Volumetric Order Blocks Work
Price action indicators identify major price zones based on buy volume. These types of order block indicators combine the analysis of price action and trading volumes. Using order block trading strategy chart analysis tools, you can identify the order levels that influence price movements, swings, and spikes. The price action tools work by displaying:
- Timeframe Swing Length
- Number of OB Per Session
- Order Block area Validation Or Mitigation
- Upward or Downward Visualization
The major contributing factor between bullish and bearish volumetric blocks are the strength calculations. If the buying pressure is higher, a green zone is formed. Meanwhile, a bearish zone indicates more selling volume within the price level.
Volume Order Blocks Multi Timeframe
Integrate volumetric blocks multi-timeframe indicators for trading. The tool provides a deeper insight into market behaviour. The analysis will enable you to find key price areas where market participants accumulate orders. You can use these zones to map support and resistance levels on the trading chart. Leveraging the market areas, you can make informed entry and exit trade decisions. Review the core features the toolkit offers for trading:
- Automatic trade detection of volumetric OB
- Customizable length setting for advanced traders
- Breaker blocks for enhanced trade analysis
- Multi-Timeframe chart capabilities
Surely, connect volumetric OB with multi-timeframe indicators for reversal trading strategy.
Price Action Toolkit
Leverage price action toolkit and strategies for trading. The toolkit offers a volumetric information add-on on the trading chart. Use the add-on to overlay the analysis layer based on volume data. You can use this mapping to know the strength and reliability of the zones. Each of the profiles shows total trade volume, volume ratios, and activity. You can get a clear indication of participation by combining the order block bars. Review the percentage ratio of high vs. low volume:
- Low %: Shows the dominance of buyers or sellers.
- High %: Indicate reduced support for the OB
Strengthen your strategy using the price action smart money algos for automated trading.
Price Action Volumetric Breaker Blocks
Use the price action volumetric breaker blocks strategy for trade setup. The toolkit helps you visualise significant price levels in the market. You can combine concepts such as price action, and market structure. These data will provide you with a comprehensive view of key support and resistance levels. You can even find the breaker blocks where the market has shown interest in the past. Leveraging this analysis, you can build your algo trading strategy. The algorithm will track structure shifts and provide you with context for price movements. Definitely, set up the Price Action Volumetric Breaker Blocks indicator to integrate order blocks into trading plans.
Automatic Volumetric Block Detection
Integrate the automatic volumetric block detection tool in your strategy. The market maker indicators highlights the price levels where buy and sell orders are accumulated. You can analyse these points to get deeper insights into market behaviour. These zones also serve as potential support and resistance levels. Leverage these points to make informed trading decisions. Review the types of automatic volumetric block detection:
- Bullish volumetric OB: These blocks are located near swing lows and serve as support levels.
- Bearish volumetric OB: These are located near swing highs and act as resistance levels.
These highlighted blocks automatically disappear once the blocks are mitigated. Integrate the automatic volumetric block detection tool to get real-time clarity.
Volumetric OB With Range Filter Indicators
Leverage range-filter indicators for your volumetric order block strategy. These actionable signals help you accurately confirm OBs before making decisions. AI TradingView algo indicator automatically issue a red “sell” signal or “sell 5 minutes” indicator once a block is validated.
>> Of course, you should still confirm that the forming candlestick is bearish. Additionally, the targeted OB zone should be dominated with red bars.
Once the bearish stick closes, you should immediately place your sell volume. Utilize stop losses and take profit targets to control your risk reward ratio. Incorporate trusted range filter indicators into your order block trading strategy.
Choosing A Volume-Based Trading Indicator
Learn the key strategies to choose the right volume-based trading indicator for your setup. Take advantage of EMA crossovers in TradingView to detect a volumetric order block. Particularly, your setup may indicate a bullish order block when the short EMA crosses above the long EMA. Meanwhile, recent highs may experience bearish OB when the short EMA crosses below longer EMA on your charts. To choose the right setup, you can always use the “Sensitivity Detection” feature to configure a customizable sensitivity during the selected time frame. Here are a few additions strategies to select a high-probability volumetric OB trading indicator:
- Perform a strength analysis to identify blocks with a stronger impact
- Prioritize indicators with block removal conditions to identify breakout signals
- Use indicators that combine formation with EMA crossovers to spot early trend reversals
- Strategic indicators with OB-boundaries to configure stop loss and entry points
Ultimately, a carefully selected volume algo indicator will combine price action, volume data, and EMA crossovers to showcase market structure along with potential reversal points.
Advanced Order Blocks with Volume
Use advanced order blocks with volume indicators for algo trading. The tool combines OB detection with a sophisticated approach. The combination allows you to find high-probability trade opportunities. You can automatically detect and see bullish and bearish levels on the trading chart. The script uses simple, relative, and weighted methods for calculation. Check out the features the indicator offers for algorithm trading:
- Automatic mitigation OB tracking
- Smart detection with advanced customisation option
- Volume-filtered to prevent false signals
- Clear presentation of metrics
- Colours and parameters customisation
You can even leverage institutional price levels to find potential reversal zones with strong institutional interest. Definitely, use best indicators for order block trading with a strategy for automated trading.
Volume Order Block Scanner
Integrate the volume scanner in your trading strategy. The tool allows tracking areas of aggressive participation from large entities. You can automatically map the institutional zone using volume-weighted order flow. The script evaluates each candle in a chart through a multi-layer model. The model uses relative volume, structure, and volatility context to analyse these areas. You can easily find genuine order block formations after filtering out the noise. Review the comparative ratios by which each candle is filtered out:
- Relative Volume Ratio (RVR)
- Body ATR Ratio (BAR)
Definitely, leverage the market structure break and order block scanner for your automated trading strategy.
Price Action Concepts Volumetric OB
Leverage price action concepts (PAC) volumetric OBs to optimize your TradingView strategy. These innovative tools highlight price zones that should be monitored for support & resistance levels. You’ll have access to both bullish & bearish volumetric blocks – these empower you to follow swing highs/lows for S&R trends. To expand your view, increase length, point detection, and lookback.
>> Use the “Hide” setting to eliminate overlapping blocks and make quick, informed, and strategic decisions.
Strengthen your volumetric order block trading strategy with volume algo indicators.
Volumetric Volatility Blocks
Connect volumetric volatility blocks tool in the trading script. The indicator allows you to identify order blocks based on price and data. The tool uses a combination of Average True Range (ATR) and Simple Moving Average (SMA) to find the volatility levels. You can use the data in your strategy to map potential trade opportunities. Moreover, the tool enables you to capitalize on periods of high volatility and shifts. Review the key features the toolkit offers:
- Volatility measurement length to calculate ATR
- Smooth Length setting for the volatility.
- Mitigation option to filter blocks based on price action.
- Custom colour settings for bullish and bearish blocks.
Integrate the Volumetric Volatility Block order toolkit into your algo trading strategies.
